Frogalytics Website Analytics
Upgrade website today for $19.95 per month
Website Traffic data is a veritable gold mine. However the problem is accessing that data quickly, easily, and in an interface that makes sense to the user. The majority of website analytics services fail in all regards. You wouldn't be here if your current analytics service met your needs. The good news is that Frogalytics is different and we will tell you how.
 Get a real time advantage
Frogalytics is a real time website analytics service. This means that when you login and view your stats, you are seeing to the minute data on the visitors to your web site. Most other analytics services don't let you see what's happening "today" until the day after
Real time data lets you react to the changes in your traffic as it occurs. For example, if you had an article that hit the front page of a popular website, you would see the traffic spike in Frogalytics immediately, along with links back to the very source that sent you that traffic. Knowing where this traffic has come from, you could make changes to your site or to the article itself to take advantage of the situation.
Today vs. History
Frogalytics is focused on real time, so by default we only show you the data from "today" when you login to view your stats. Historical data is also available, just click the blue drop down menu in the top right corner to get the menu shown to the right hand side.
Popular choices such as yesterday or the last 30 days are available as default options. You can also view a custom date or date range by clicking the last item in the menu, Custom date range...
With this option, you can view a date range for any report with up to 1 year of data. The exception is the Visitor log and the Action log pages - these are limited to 31 days maximum.
Viewing the history for an individual page, search term or referring domain and more
As mentioned previously, you can view just about any report with up to a full year's worth of data. Doing so just gives you the total sum for any individual item over that entire date range, it's fantastic.
What if you want to view up to a year's worth of history for any individual item?
This is possible with just a single click, and is one of the most useful features of Frogalytics! Below is an example of part of your site's dashboard that shows you the types of traffic sources to your web site.
Each item has a number next to it representing how many visitors arrived from that type of traffic source. To the right of that number is what's called the "trend" for that item, vs the day before, taking into account the current time of day. (Green percentages are "good", and red are "bad". Green usually means "more", but sometimes more is bad).
To view the history on any item, simply click on the trend percentage, as shown below. By default you will see the last 30 days of data for that item, but there is a date drop down menu right above the graph which lets you view the daily values for up to 180 days, or the weekly sums for 26 weeks (half a year), or the monthly sums for the last 12 months. Some data types also support hourly data.

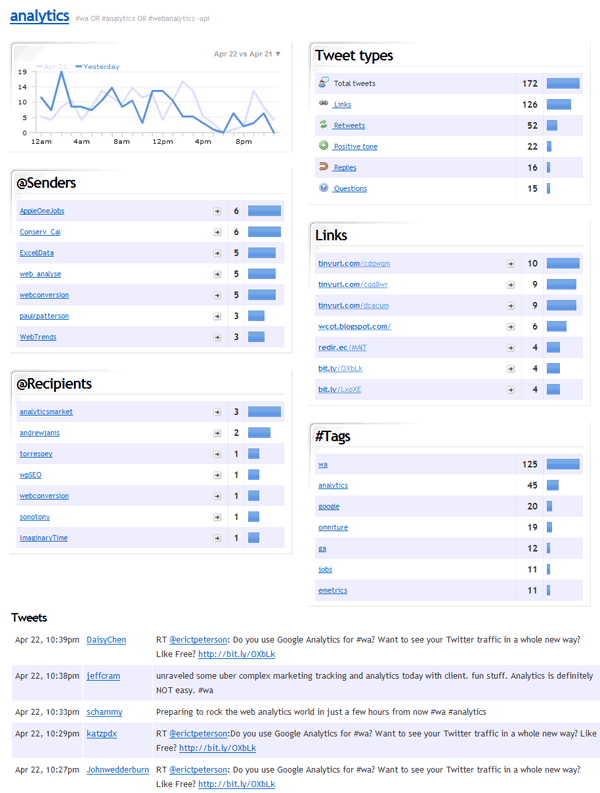
Built in Twitter Analytics
Also with built in Twitter Analytics, A lot of people are talking about you and your web site. But do you know what they're saying? It can be hard to keep track of it all.
With built in Twitter Analytics you simply enter in keywords that you want to monitor and Frogalytics will do the rest for you, creating beautiful reports like the one below.
You can filter the individual tweets or sort by criteria (e.g. ones containing links, one with questions, ones with a positive tone), and you can reply or retweet directly from Frogalytics.